Bookender: A Book Recommendation System
I built a book recommendation system over the past few months as my capstone project for a data science bootcamp, The Data Incubator. If you’d like to read more about my experience there, I’m planning to write about that as well and I’ll include a link here when I do. In this post, I’ll outline the structure of my recommendation system and write about my experience building it.
Design
I wanted to build something lightweight for two reasons: first, it’s easier to build; and second, I use Goodreads and, while it has everything it needs to make good recommendations, it’s too clunky for that purpose and so I don’t use it for recs.
My app would simply take a list of liked and disliked books from the user and return a list of recommendations after some optional user filtering. Pretty simple.
Data
First, I needed lots of user rating data and book data. Thankfully, the horrible design of Goodreads makes it fairly easy to collect these data. The url https://www.goodreads.com/user/show/{i} gives you information about the $i$th user. And it’s chronological. Can’t believe they did that honestly.
To get unbiased ratings, I sampled $i$ uniformly randomly from 1 to 122222221. These endpoints roughly correspond to the birth of Goodreads to around September 2020. Then I obtained all the book ratings of this user. Rinse and repeat.
I also needed a separate dataset consisting of book features. I collected all the books that my users rated and got shelf information about them. Shelves are user-created categories. Common ones are “read”, “fiction”, “religion”, etc. I figured these shelves carried interesting information about the book.
In total, I had about 1M ratings and 300K books. For my purposes, I winnowed my books down to those that were rated by at least five of my users. This left me with 700K ratings and 30K books.
The Model
After collecting the data, I need a model to predict books that a user will like but haven’t read yet. I used a modified version of the ALS recommendation algorithm, which I will describe below.
The following regressor will take any user-book pair as input and give a rating prediction. There are two parts to this regressor: the baseline model and the residual model. The final model will simply combined the two like so: ++ \text{model}(\text{user}, \text{book}) = \text{baseline}(\text{user}, \text{book}) + \text{residual}(\text{user}, \text{book}). ++
The Baseline Model
The baseline model is a rough initial guess for the rating of a user-book pair without taking into account user-book interaction. The baseline model looks like ++ \text{baseline}(\text{user}, \text{book}) = \mu + f(\text{user}) + g(\text{book}). ++ Roughly, the baseline model is finding the mean rating and calculating how much each user deviates from it on average, and how much each book deviates from it on average. Specifically, I just one-hot encode the users and books, then perform ridge regression. I tried a couple of other things but simple is good here.
Note that if we rank the books for each fixed user, the rankings will be identical. There is no personalization here. This is simply setting the scene for personalization.
The Residual Model
This is where we get to model the user-book interaction and open up the model to personalization. First, let’s talk about the book feature data.
The raw data I collected is a json file of books and their top 100 shelves. Because we don’t care about every single user-defined category, I selected the top 500 most popular shelves and filtered out all other shelves. So I have a json file which roughly looks like this:
{'1234': {
    'read': 2834,
    'fiction': 1093,
    'fantasy': 990,
    'coming-of-age': 93
    },
 '1235': {...},
 ...
}
Here, 1234 and 1235 are book ids. I divided each bookshelf count by the sum of the bookshelf counts and included a total bookshelf count as a feature. Then I took the log of each feature, which seemed to improve performance by a significant amount. Then I centered and scaled my data and put it in a matrix $M$, whose rows correspond to features and columns correspond to books. I have 500 rows at this point, but a lot of these shelves are redundant (e.g. “young-adult” and “ya”), so I used PCA to reduce to 75 rows.
Now I must learn my user preferences. I initialize a matrix $U$ whose rows correspond to learned features and columns correspond to users. The matrix $UM$ will tell us the deviation from the baseline model that we should predict. For example, suppose books only had two features: ‘fiction’ and ‘fantasy’. Suppose a certain user, Alice, really likes both fiction and fantasy books. Say their coefficient for ‘fiction’ is $0.3$ and for fantasy is $0.5$. Let’s predict their rating for a book which has ‘fiction’ value $0.9$ and ‘fantasy’ value $1.2$ (maybe this book is Harry Potter and the Sorcerer’s Stone). The prediction would be ++ \text{model}(\text{Alice}, \text{HPSS}) = \text{baseline}(\text{Alice}, \text{HPSS}) + [0.3 ~ 0.5] \begin{bmatrix}0.9 \\ 1.2\end{bmatrix}. ++ So we’d have ++ \text{model}(\text{Alice}, \text{HPSS}) = \text{baseline}(\text{Alice}, \text{HPSS}) + 0.87. ++
If we collect all users and all books, then we get two matrices which look like this: ++ U = \begin{bmatrix} \vdots & \vdots \\ 0.3 & 0.5 \\ \vdots & \vdots \end{bmatrix}, \quad M = \begin{bmatrix} \dots & 0.9 & \dots \\ \dots & 1.2 & \dots \end{bmatrix}. ++
And the residual model would consist of getting the correct row (user) and column (book) from the product matrix $UM$: ++ \text{residual}(\text{user}, \text{book}) = (UM)_{i,j}. ++
The user preference matrix $U$ must be learned from the data. The classical setting is that the book feature matrix must be learned as well, which poses a difficulty since two matrices must be learned simultaneously while the loss depends on their product.
In our case, it turns out that the bookshelves provide a lot of information! So I actually haave two residual models.
- The first gets the optimal user preference matrix $U_1$, with a fixed book feature matrix $M_1$ derived from the bookshelf data. This is a single linear regression.
- The second, on top of the first, learns the optimal user preference matrix $U_2$ and the book feature matrix $M_2$ simultaneously. The training process is called the Alternating Least Squares (ALS) method. The idea is that we fix $U_2$ and find the optimal $M_2$, then fix $M_2$ and update $U_2$, and so on until convergence.
The final model is the sum of the baseline model and the two residual models.
Training
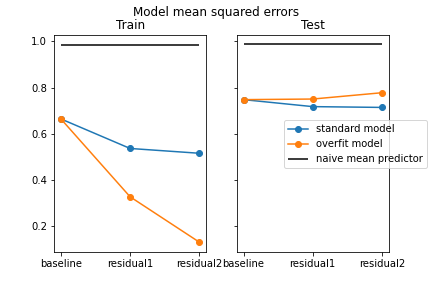
Here we have a graphic comparing training and testing errors of our models. One thing to keep in mind for my application is that we are not necessarily looking for the lowest testing error. The model with the lowest test error I could get actually didn’t give me very meaningful predictions. It just suggested quite highly rated popular books, no matter what data I inputted. In this case, it helped to have a little bit of overfitting. The model I used in the application is the overfit model. The best-performing model is the standard model, which had a 4.5% improvement over the baseline model. The error here is mean squared error.
| Model | Train Error | Test Error |
|---|---|---|
| Naive mean predictor | 0.986 | 0.986 |
| Baseline model | 0.664 | 0.748 |
| Standard model | 0.516 | 0.714 |
| Overfit model | 0.132 | 0.778 |
Clustering
The intermediate products $U_1$ and $M_1$ of my model actually may be interesting to look at. We might be able to visualize some structure in our user and book data.
Let’s learn the matrices $U_1$ and $M_1$ with two dimensions. So when we do PCA on $M_1$, we will set $d=2$ and correspondingly $U_1$ will have two columns. We train with the usual hyperparameters otherwise, then we can plot $M_1$ to visualize how users rate books.
Below, we have such a chart. You can click and drag on the user side (ux, uy) to isolate a certain user or users, then see which books they rated on the book side (bx, by).
The users on the lower left seem to be the ones with harsher ratings (one of them seems to have exclusively assigned ratings of value 1) and the ones on the upper right seem to be more generous. Theoretically this should’ve been taken care of with the baseline model, but with the regularization, the residual model also plays a part in shifting the mean of the user.
Some users seem to have preferences for books in a certain area, for example the rightmost user.
Conclusion
I set out to recommend books to users based on their preferences. I collected data from Goodreads and built a 3-part model. The baseline model was a simple linear model, and the next residual model predicted the residual from the book features that I collected from Goodreads. The last residual model predicted the residual from learned user and book features. Again, you can see the app here.